SCIREA is a scientific publisher that has a portfolio of 39 journals. These 39 journals have 13,288 editors, meaning that each journal has an average of 341 editors. Each of these editors has handled less than one paper each, over the last five years.
The aim of these articles is to gain an insight into a specific journal or publisher and get a view of their practices and how they operate. We are particularly keen to provide an evidence based analysis, rather than being (too) subjective.
We occasionally give a view as to whether we believe a journal, or publisher, is predatory but we would rather present our findings and let others be the judge.
In this article, we present the data we have collected for SCIREA, with regard to the number of editors they have.
Who are SCIREA?
SCIREA is an open access publisher that publishes 39 journals (as at July 2021). Its Article Processing Charges (APC) are about USD 230. Each journal has its own APC page, but the ones we looked at were all USD 230.
None of the SCIREA journals appear to have an ISSN and they do not seem to be members of either COPE or DOAJ.
Looking at their web site, the majority of the journals started publishing in 2016. They generally publish each year, but there are some notable exceptions. For example, the SCIREA Journal of Hydraulic Engineering has published four articles, one in October 2016, one in October 2019, one in February 2019 and one in February 2021.
SCIREA is listed on the Stop Predatory Publisher web site.
Data collected for SCIREA journals?
To carry out our analysis we collected the following data:
- The journal names
- The journal URLs
- How many editors each journal has
- How many papers each journal has published
The data for each of the journals was collected manually, which was an easy task as there are only 39 journals. We also captured the URL of the journal as this would be useful later.
The editors are listed at one URL (as well as being listed on each journal’s pages). Nineteen editors are listed on each page and there are 700 pages (the final page has less then 19 editors listed). Each editor has their name, country, institution and the journal they serve. It was an easy matter to write a script to scrape the data from the web site. We had to scrape the web site, as manually collecting all the editor data was not possible.
Each individual journal lists all of the articles that it has published on a single page. It was easy just to collect the total number of papers each journal had published, by inspection. Note, we did not collect information about each article, just the number of articles that had been published.
This data collection showed that SCIREA publishes 39 journals, they have 13,288 editors and have published 654 papers (as at July 2021).
SCIREA: Number of Editors by Journal
Figure 2 graphically shows the number of editors for each of SCIREA’s journal. There is a lot of data on the image, and if you click on it, you’ll see a larger version. We have also presented this data in Table 1, as this may be preferable for some people.
In total, SCIREA has 13,288 editors across its portfolio of 39 journals. That is an average of 341 editors serving each journal.
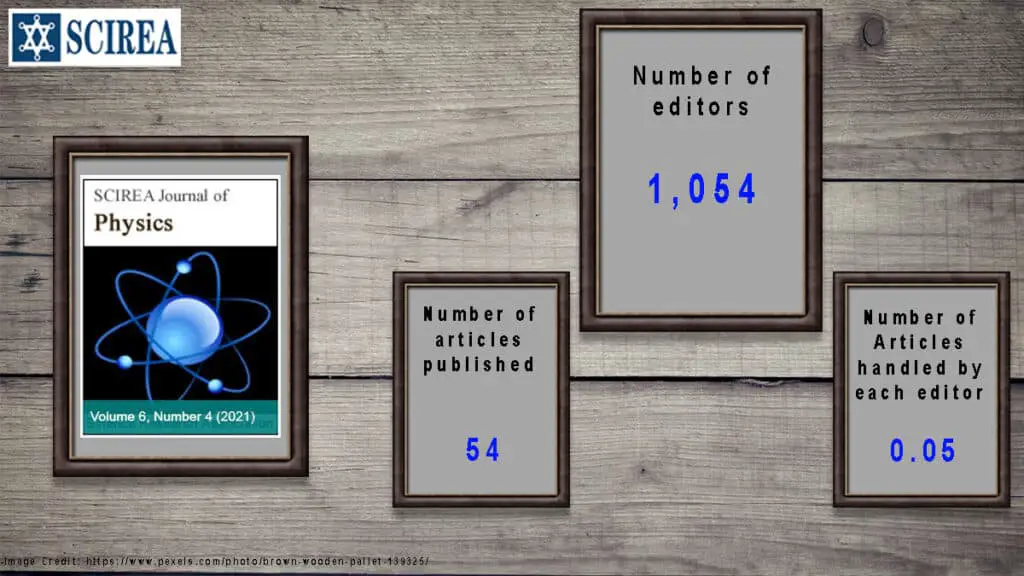
The number of editors ranges from 1,054 (SCIREA Journal of Physics) to 25 (SCIREA Journal of Surveying and Mapping). The number of editors, alone, is not really relevant unless you make a relative comparison, with the number of papers that the journal has published, which we do below.
[table id=072_001 /]
SCIREA: Number of Articles by Journal
Figure 3 shows the number of articles that have been published by each journal in the SCIREA portfolio. SCIREA has published a total of 654 articles.
The number of papers published ranges from 85 (SCIREA Journal of Clinical Medicine) to one article for three journals. Two journals have yet to publish.
It should be noted that this is the number of articles since each journal started publishing which, is typically in late 2016. As we mention above, some of the journals publish regularly, but others are a little more erratic. We assume that the publication schedule is dictated by the submissions (and acceptances) that the journals receive.
We realize that Figure 3 is quite detailed. You can see a larger image by clicking on it, but we have also provided the data in Table 2 for those readers that find it easier to access the data in that format.
[table id=072_002 /]
How many papers does an editor handle?
Table 2 also shows (final column) the average number of articles that each editor has handled. This is calculated by taking the number of editors (see Table 1) and dividing it by the number of articles that have been published (see Table 2). In looking at this figure, the following should be noted:
- The total number of articles is the total that have been published since the journal was started. That is, it is NOT the number of articles in (say) a twelve month period.
- The number of papers we have calculated that has been handled by each editor is measured over the lifetime of the journal, NOT how many articles have been handled (say) every year.
- Most of the journals started in 2016 so, if you want to calculate how many articles are handled each year by the editors you would need to divide the number by about 5.
The journal that has the highest “Articles per Editor” figure is the SCIREA Journal of Astronomy. On average, each of the 26 editors has handled 0.23 papers. This journal has only published six articles, one in 2017, two in 2018 and three in 2019. They are still inviting submissions, so we assume that the journal is still active.
This figure of 0.23 assumes that the number of papers published was the same number as were submitted. This is not a good assumption as any journal will have rejected a number of papers, but these still have to be handled by one of the editors.
If we assume that the rejection rate is 50%, then the number of papers handled by each editor would be 0.46.
You might feel that a 50% rejection rate is unrealistic. Let’s say that the SCIREA Journal of Astronomy rejects 75% of the papers it receives. This would mean that, on average, each editor would handle 0.92 papers.
To be absolutely clear, even if the journal rejected 75% of the papers it received, the 26 editors of SCIREA Journal of Astronomy, would have handled less than one paper each. And this is over the lifetime of the journal (four years), so that would be less then 0.25 papers each year, for each editor.
Every other journal in SCIREA’s portfolio has an average less than the SCIREA Journal of Astronomy, meaning that, on average, none of their 13,228 has handled more than one paper since the publisher started in (typically) 2016.
Final Remarks
Given how many papers SCIREA has published, they appear to have a lot of editors. So many in fact, that on average each editor would handle less than one paper every five years, and possibly a lot less.
In our experience, a typical editor would be expected to handle 5-6 papers a year. Of course, disciplines differ and that number could be a lot less and we know of editors that have handled many more.
Perhaps our analysis is in this article is wrong and that we have not fully understood how the journal works. Perhaps the editors carry out more work than we are suggesting?
We would be delighted to hear from an SCIREA editor who we would give the opportunity to relate their experiences in a blog post. We would also be delighted to hear from the the journal itself and we offer them the same opportunity to respond to this article, which we would be delighted to publish.
Finally, we have been tweeting about SCIREA and if you want to see these tweets, please follow this link.