Disclosure: This page contains affiliate links. This means, at no additional cost to you, we receive a commission if you click through and make a purchase.
Introduction
WASET (World Academy of Science Engineering and Technology) advertises over 300,000 conferences a year, approximately 900 every day. On one particular day it advertised 8,894 conferences. In the past six years, we estimate WASET’s revenue to be between EURO 8.95m and EURO 11.94m from these conferences.
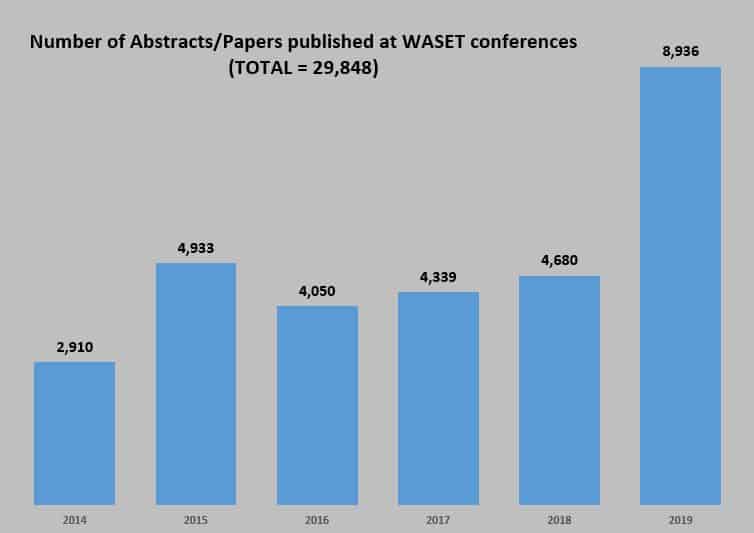
The number of presentations at WASET conferences is increasing, from 4,680, in 2018, to 8,936, in 2019. WASET conference sessions are an amalgamation of all the conferences advertised on that day/location.
In this article, we look at the WASET (World Academy of Science Engineering and Technology) conferences. We look at the WASET conference series from different perspectives to enable you to decide if WASET conferences are reputable, or whether they are a business venture where the motivation is more financial, rather than advancing science.
We note that the data collected for this article was carried out in early 2020.
Article Background
We want to provide some background information about this article. It was made available to us after the author had tried to get it published in a number of journals. Some of the comments that the editors made was that it was an “important topic“, “we do not carry out expose’s” and “it is too focused on a single publisher.“
We, along with the author, accept the editors view, but believe that information such as that given in this article should be made public, if nothing else, to inform others so that they can draw their own conclusions and make their own decisions.
The article that was made available to us was more academic than the article presented here. For example, it had a scientific literature review than has not been re-produced here and some of the finer details have been omitted from this article.
We know that the author is still keen to publish this work in a peer reviewed journal if nothing else, so that the data and conclusions that are drawn have been validated by others. If any editor would like to consider a paper based on information presented here, please get in touch (admin@predatory-publishing.com) and we will make the introductions, with no obligation on either party.
Previous Article
We have looked at WASET conferences before, in one of the first articles that we wrote. Please take a look at “WASET: 2020 Conference Schedule.” That article opened by saying:
“In 2017, the Times Higher Education, reported that the World Academy of Science, Engineering and Technology (WASET) were planning to run 183 events in 2018, which will cover almost 60,000 individual conferences. That is, about 320 conferences at each event.”
The article gave various estimates about how many conferences WASET advertised. The updated numbers in this article shows that these numbers were underestimates by some amount.
Data Collection
Creative Commons Acknowledgement
The WASET web pages says that the pages are subject to Creative Commons Attribution 4.0 International License. This license states that “You are free to: share, copy and redistribute the material in any medium or format. Adapt, remix, transform, and build upon the material.” It further states that “Attribution: You must give appropriate credit, provide a link to the license, and indicate if changes were made. You may do so in any reasonable manner, but not in any way that suggests the licensor endorses you or your use.”
We acknowledge waset.org for their permission and we provide a link to the https://creativecommons.org/licenses/by/4.0/.
Collecting the data
The data collection for the conference data started from https://waset.org/conferences-in-2021 (we actually started from 2020, as we collected dated last year, but we give the 2021 URL as it is valid at the time of writing). In this URL, the last four digits represent the year, so you can access conferences for the following years, using the URL given:
- 2021: https://waset.org/conferences-in-2021
- 2022: https://waset.org/conferences-in-2022
- 2023: https://waset.org/conferences-in-2023
As you cannot see the conferences for previous years, you cannot see 2020 (but we could when we collected the data originally), and you can only see three years of conferences so, at the time we collected the data we could access 2020, 2021 and 2022 whereas now you can access 2021, 2022 and 2023. You can actually see conferences up to 2032, but cannot access at the same level of detail for the next three years.
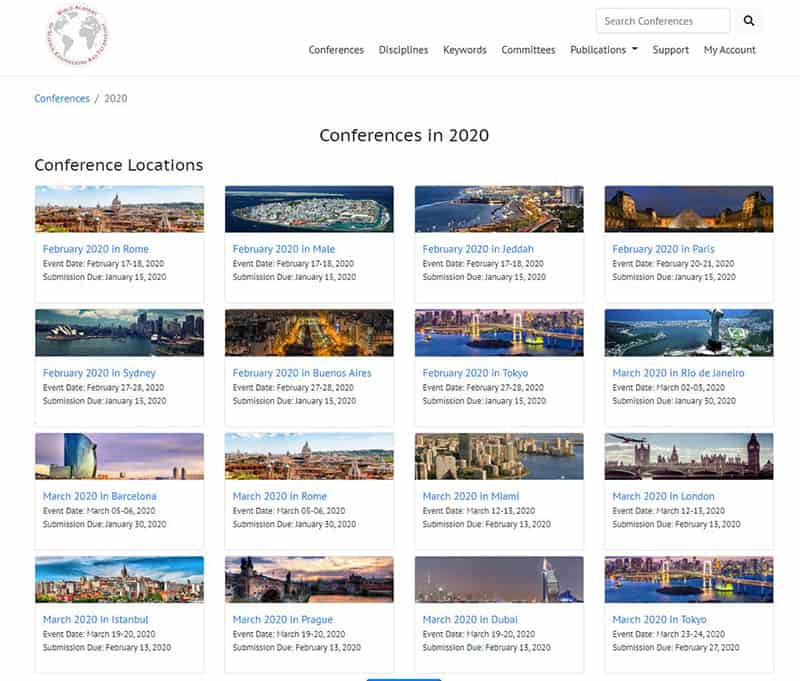
If you follow one of the links above, you are presented with a list of conference locations. A typical image is shown in Figure 1. If you follow one of these links, it leads to page where there is a list of conferences being advertised at that location, on specific dates. A typical page is shown in Figure 2.

Collecting and analyzing the data
We wrote a PHP script that collected data from the WASET web site. By accessing the top level page for each year (as shown in Figure 1) we were able to gather all the URLs for a given location/date. We were then able to follow these URLs, enabling us to capture all the conferences for that location/date.
Using this methodology, we were able to collect details about all the conferences for 2020, 2021 and 2022.
Once the data had been collected, we imported it into Excel and used Pivot Tables to carry out the analysis. Where this methodology was not suitable, we manually observed the data to draw our conclusions.
Abstracts/Papers
To access the papers for a given conference, where we can now look backwards in time. The format of the URL is:
https://panel.waset.org/conference/yyyy/mm/location/program
… where:
- yyyy is the year
- mm is a two digit month
- location is the city where the conference took place.
For example, to access the conferences in London in January 2019, you would use the URL https://panel.waset.org/conference/2019/01/london/program.
Given that the URL is structured in this way, it is easy to write an automated script to process every page and extract the information about abstracts/papers that have been published. We collected all the abstract/paper data between 2014 to 2019 (six years). We have not provided 2020 in our main analysis as, at the time the data was collected, 2020 was not yet complete. We could not collect data prior to 2014 as the URL’s were invalid.
Number of conferences and locations
We analyzed the WASET conferences for 2020, 2021 and 2022. Table 1 shows the number of conferences that are being advertised for these three years.
| Year | Number of Conferences | Average/Day |
|---|---|---|
|
2020 |
313,745 |
857 |
|
2021 |
343,283 |
941 |
|
2022 |
345,063 |
945 |
|
TOTAL |
1,002,091 |
|
|
Table 1: Number of WASET conferences advertised each year and the average advertised each day |
||
We have never heard before of any other organization advertising about 900 conferences every single day. That assumes that they are running conferences every day, which is not actually the case.
Carrying out more in depth analysis, and looking at how many days conferences are actually run, Table 2 , shows the number of days that a conference started on (without exception, each conference lasts two days). As an example, the table shows that in 2020, of the 366 days available, conferences started on 98 of those days. This means that there was, on average (313,745 / 98) = 3,201 conferences on each of those days. The minimum number of conferences was 1,093 (16 Nov 2020), with the maximum being 8,894 (30 Jan 2020).
| Year | Number of conference start dates | Average/Day | Min | Max | |
|---|---|---|---|---|---|
|
2020 |
98 |
3,201 |
1,093 (16 Nov) |
8,894 (30 Jan) |
|
|
2021 |
91 |
3,772 |
1,954 (05 Jul) |
8,045 (28 Jan) |
|
|
2022 |
92 |
3,751 |
1,954 (05 Jul) |
8,045 (28 Jan) |
|
|
Table 2: Number of WASET conferences on a given date |
|||||
It is amazing that any organization can manage over 900 conferences in a single day, but to manage, on average, over 3,000 is remarkable. On some days that figure rises to almost 9,000 conferences on any single day.
However, we know that although a set of conferences is advertised in a specific city, on a specific date, not all the conferences are run, as WASET does not receive submissions to every conference. This is not only evidenced by other reports, but also from our own analysis which shows how many papers were actually published.
All the conferences that have been advertised, at a given location, on a given date, actually take place at the same time in a single room. There is no concept of individual conferences taking place, they are all merged together. These conferences are under the banner of the International Research Conference, no matter how many individual conferences were advertised.
This, presumably, is how WASET manages to advertise (and “run”) so many conferences. They have a database of conference names, the text to advertise each conference is generated, just filling in key information and any submissions they receive are just merged into a single conference at the given location/date. As long as they have a robust conferencing system (which appears to be the case), they can, it appears, easily manage 300,000+ conferences a year. They only seem to be limited on coming up with conference names.
Conference Locations
Figure 3 shows how many WASET conferences are being run in 2020 (the other years are comparable). It shows, for example, that 22,178 conferences are being run in Rome and 22,006 are being run in Paris. Of the 52 locations, the city with the lowest number of conferences is Dubrovnik, with 1,125 conferences.
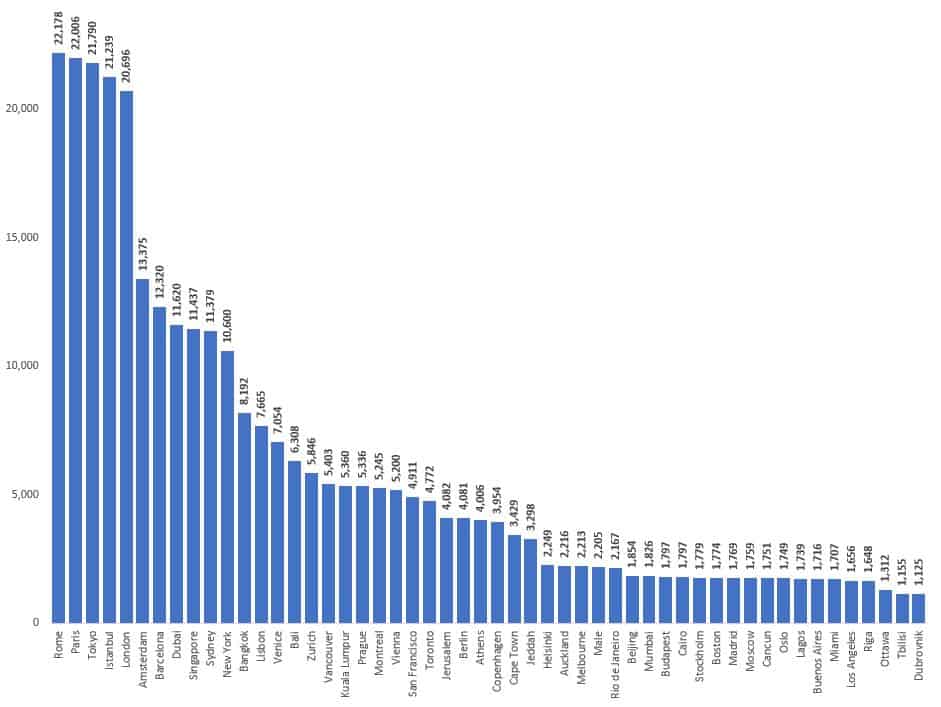
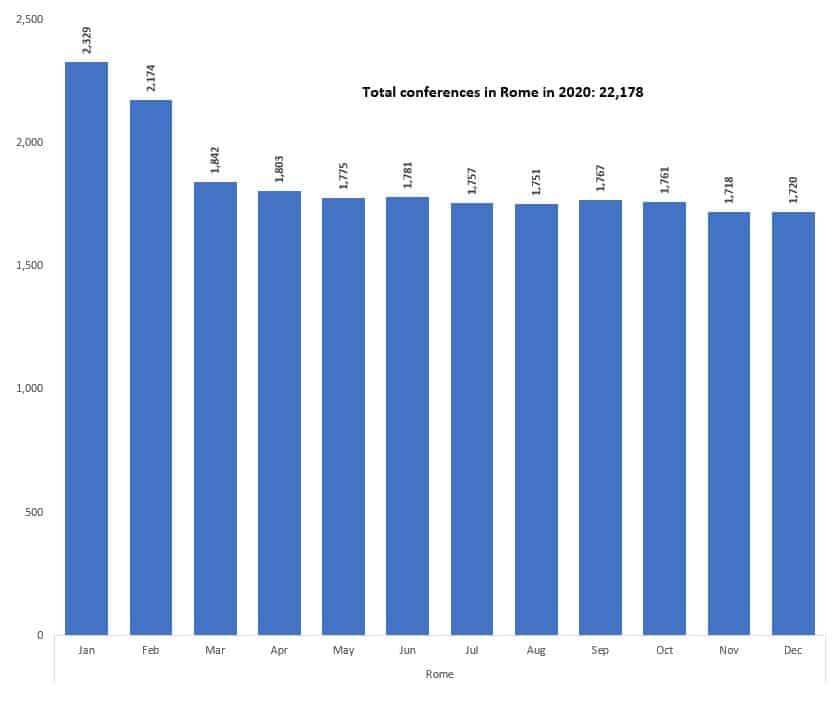
However, not all of those conferences take place at the same time. If we look in more depth at one of the locations, we see that WASET conferences are run several times most cities. Rome, for example (see Figure 4) has conferences every month, whereas Dubovnik has all of its 1,125 conferences in October.
Abstracts/Papers Published
As previously mentioned, we collected data from 2014 to 2019 for all the publications listed at the WASET conference web site. Figure 5 shows the number of abstracts/papers published by WASET in 2014-2019.
It is noticeable that in 2019, there was a significant increase from the previous years, in terms of number of papers published.
At the time of data collection (02 Mar 2020), 2020 was not complete, so we have not included it in the graph. However, we did collect as much data as we could. We expected to see only a few papers (i.e. only papers from conferences in Jan/Feb 2020 being listed). In fact, there were already 7,669 papers listed, including 50 papers for Zurich in July 2020, 32 papers in Amsterdam in Aug 2020, 11 papers in Athens in Oct 2020, 5 papers is Kuala Lumpur in Dec 2020 and 25 papers in Cape Town in Nov 2020. Based on this data, it suggests that 2020 will significantly exceed the number of papers published in 2019.
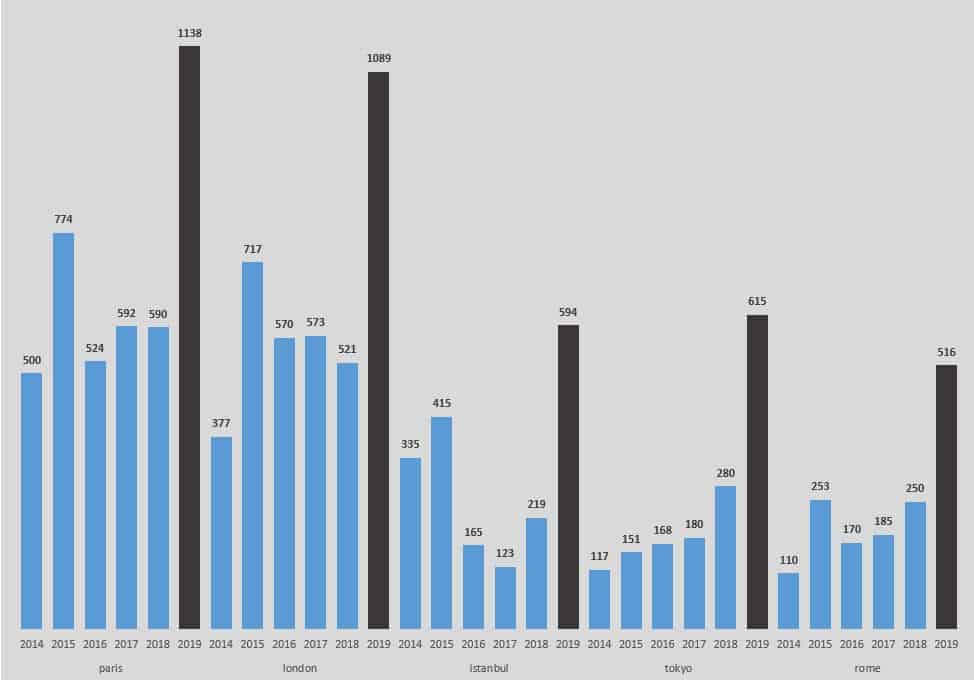
We further analyzed the data, looking at the cites where most papers have been published (Paris, London, Istanbul, Tokyo and Rome). Figure 6 shows these top five cities and how many papers have been presented in those cities. It is noticeable that each of these cities have seen an increase in 2019. This is a pattern that can be seen in many of the cities, but certainly not all.
Revenue Estimates
There have been several attempts to calculate WASET’s revenue. Using the data from Figure 5, we provide our own estimates.
Looking at a random set of conferences the registration fees varies between EURO 300 and EURO 400. Higher fees are payable if, for example, you miss the early bird discount.
Assuming that one person registers for each paper that is accepted, Table 3 estimates the revenue, for each year, based on three registration rates.
| Year | Abstracts or Papers | Revenue (EUR 300) | Revenue (EUR 400) | Revenue (EUR 500) |
|---|---|---|---|---|
|
2014 |
2,910 |
873,000 |
1,018,500 |
1,164,000 |
|
2015 |
4,933 |
1,479,900 |
1,726,550 |
1,973,200 |
|
2016 |
4,050 |
1,215,000 |
1,417,500 |
1,620,000 |
|
2017 |
4,339 |
1,301,700 |
1,518,650 |
1,735,600 |
|
2018 |
4,680 |
1,404,000 |
1,638,000 |
1,872,000 |
|
2019 |
8.936 |
2,680,000 |
3,127,600 |
3,574,400 |
|
TOTAL |
29,848 |
8,954,400 |
10,446,800 |
11,939,200 |
|
Table 3: Estimated revenue from WASET conferences |
||||
Final Remarks
WASET conferences appear to getting ever more popular. Whether this is due to the ever increasing number of conferences that WASET advertise, the “publish or perish‘”pressure on academics, tacit cooperation between academics and WASET, or some other reason(s) we are unsure. It is probably not a mistake that the majority (if not all) WASET conferences are held in cities that many people would like to visit, but this has been true for many years.
If you want to improve your writing, or are inexperienced, you may want to seek advice from your supervisor and/or access some of the many materials that are out there, such as Writing for Publication by Mary Renck Jalongo and Olivia Saracho and Novice Writers and Scholarly Publication, edited by Pejman Habibie and Ken Hyland.
It is not hard to be persuaded that WASET exists purely to make money for the organizers. Table 3 gives some indication of the revenue. Of course, there will be costs for venue hire etc. but there does appear to be scope to return a significant profit, after expenses, taxes etc.
We leave it to the reader to decide if WASET conferences are a good outlet for this work but we hope that an editor considers working with the author to publish detailed, and up to date results, in a peer reviewed paper.
There have been a number of other investigations of WASET conferences. Perhaps the most enlightening, and entertaining, is this video, which provides details of an investigation into WASET.
There are several other links and videos in our previous article.