
How many conferences do WASET run?
We estimate that WASET plans to run over 140,000 conferences in 2020, across 49 cities. This is an average of over 2,800 conferences in each city and over 380 conferences each day. We have since done a much more detailed analysis, in our article “How many conferences does WASET organise?” This estimates the number of WASET conference in 2020 to be OVER 300,000.
In 2017, the Times Higher Education, reported that the World Academy of Science, Engineering and Technology (WASET) were planning to run 183 events in 2018, which will cover almost 60,000 individual conferences. That is, about 320 conferences at each event.
In a DEFCON presentation (see the video below, which we have started at 19m 50s) the number of WASET conferences in a year was given as 53,467.
This article provides more details about WASET’s 2020 conference plans and how we collected and analyzed the data.
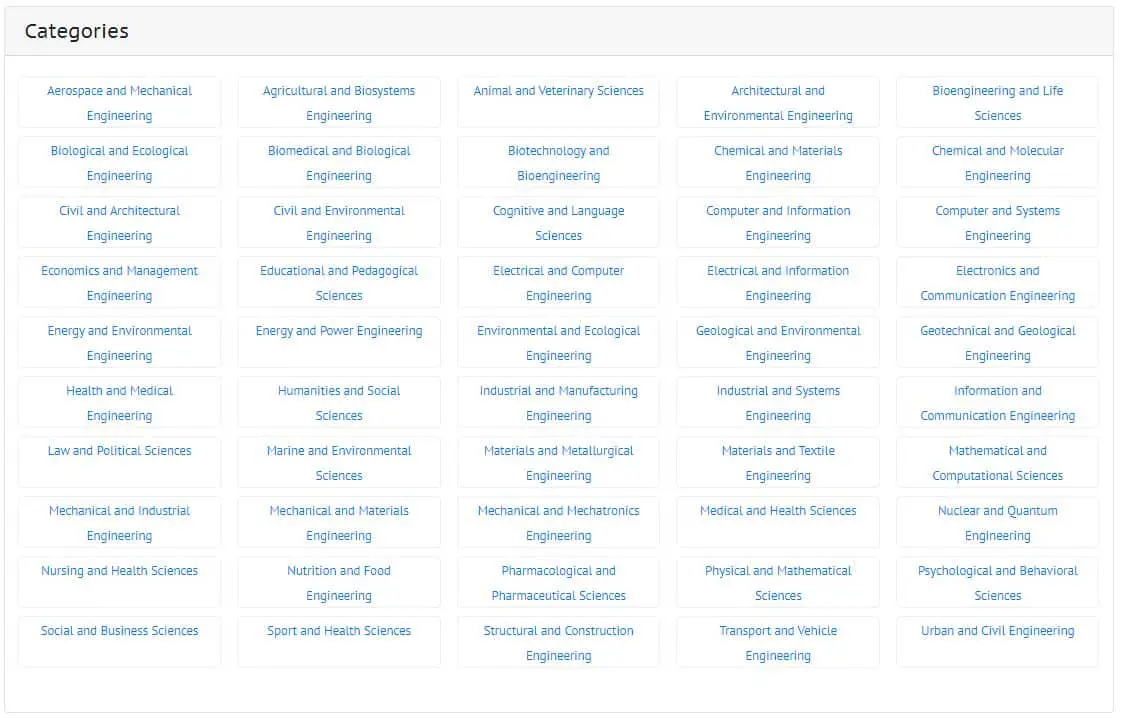
We collected data from the WASET web site (accessed 04 Jan 2020). On their home page is a section marked “Categories”, which lists 50 different areas (see right image). This is where we collected the data from. We went to each of the 50 categories and downloaded the 2020 conferences that were listed on that web page. This was done, but copying and pasting into Excel, where we processed the data after the data collection was completed.
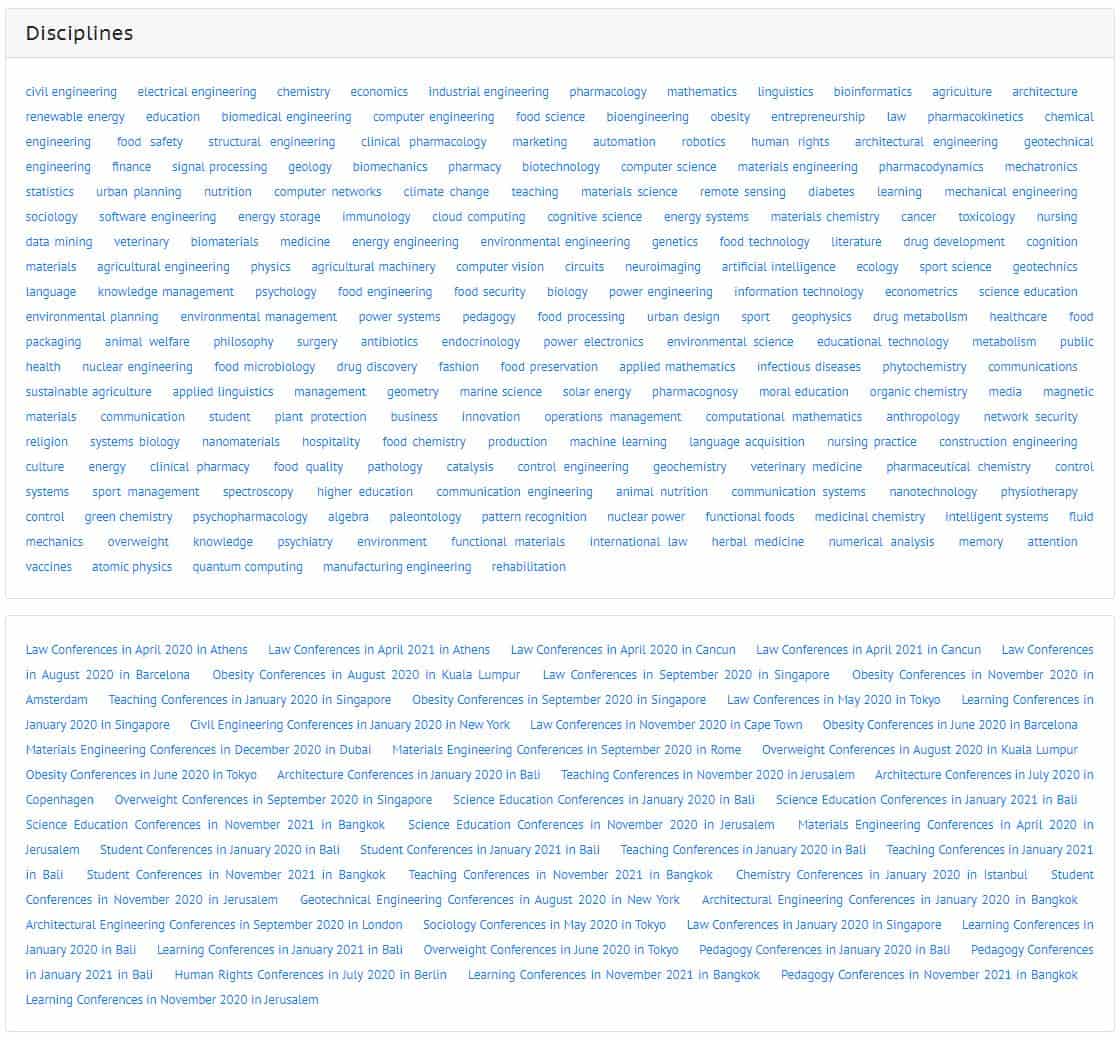
There are other ways that the conferences are presented on the WASET home page (see left image). That is, WASET also lists the conferences by discipline. We did not look at the conferences through this lens, and it might be the case that even more conferences are listed by discipline. We decided not to collect all this data, but we may do for a more in depth study that we are planning.
As mentioned, the data we collected was processed in Excel, which enabled us to carry out the analysis and produce the graphs that are shown in the rest of this article.
The initial processing involved splitting the data into its constituent parts (Category, Conference Code, Conference Name, Location, Start Date and End Date). This was done using basic Excel functions/formulae.
The analysis was also carried out by Excel functions/formulae, as well as utilizing Pivot Tables, to enable us to look at the data in different ways and graph the data as presented in this article.
If you are interested in improving your Excel skills, you might want to take a look at Excel 2019 Bible, although there are many other excellent books available, as well as many YouTube tutorials.
Initial Analysis of WASET conferences
Before looking at the data in detail, we thought it worthwhile just taking a high-level view.
In total, WASET will host (or at least advertise) 142,791 conferences in 2020. That is, on average, 390.14 conferences every day (2020 is a leap year before you question the maths :-)).
Looking at the dates in a little more detail, every conference is a two-day conference and there are 93 start dates so, there are (on average) (142,791 / 93) = 1,535 conferences starting on each of those 93 days.
The conference are split across 50 categories, taking place in 49 cities.
We analyzed the conference titles, assuming that many would be repeated. In fact, of the 142,791 conferences, only 179 have the same name as another conference. We find it amazing that WASET are able to come up with (142,791 – 179) = 142,612 unique names. This, in itself, is remarkable.
Number of WASET Conferences by Location
Using the data that was collected, as described above, we have a database of 142,791 conferences, which are held in 49 different cities. That is an average of 2,914 conferences in each city. However, Cairo only has one conference, and London has the most hosting 12,099; that is an average of 33 every day.
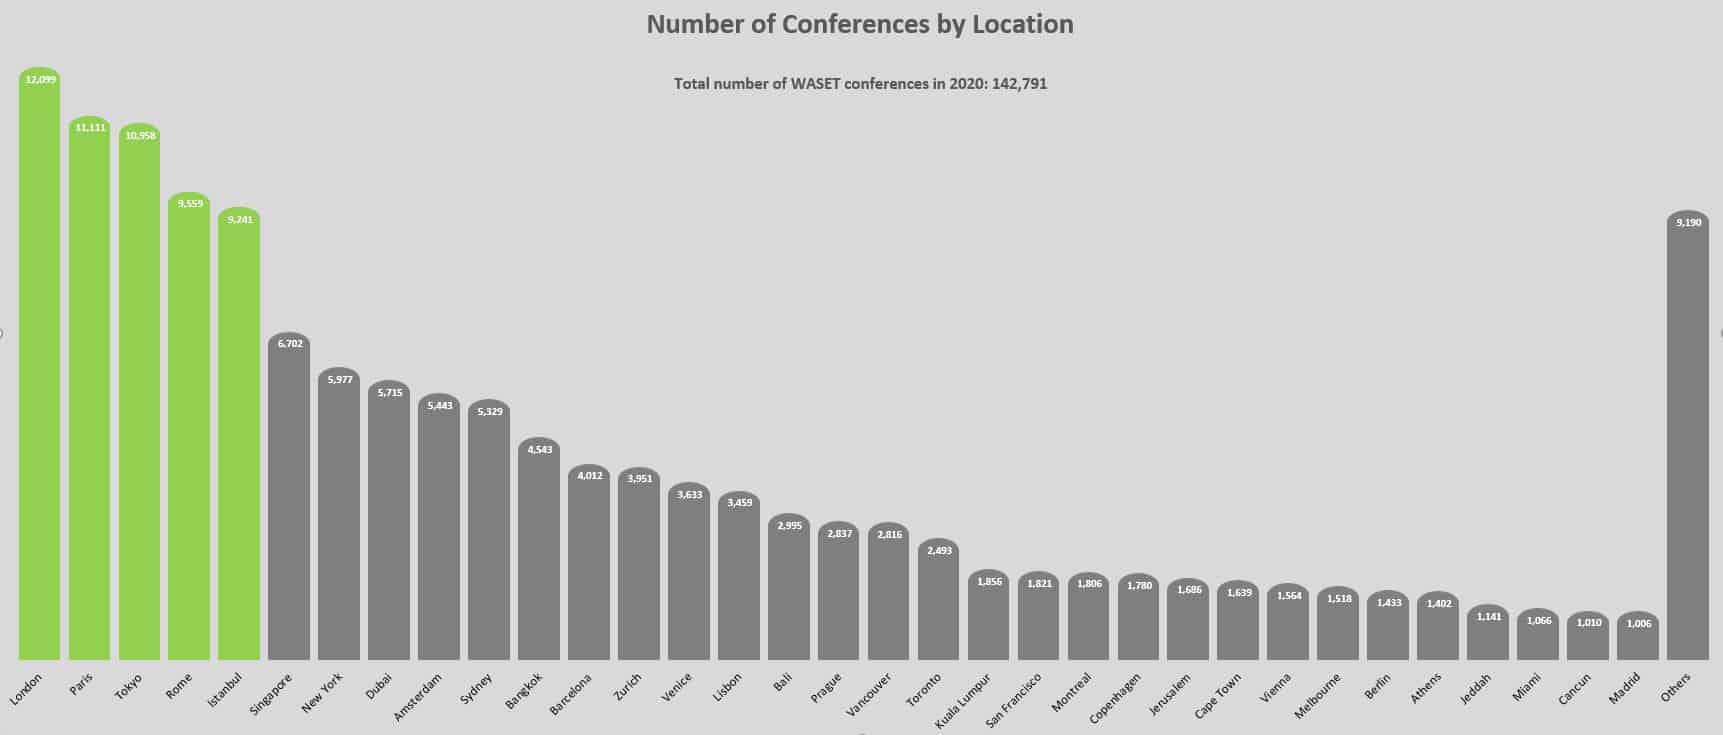
This image shows the number of WASET conferences by location. You can see a larger version of it by clicking on the graph. The graph is sorted by the number of conferences at that location, with the five locations, with the most conferences, highlighted in green. Any locations that have less that 1,000 conferences are added together into the “Other” category. This category contains 16 locations (Rio de Janeiro, Buenos Aires, Boston, Dubrovnik, Stockholm, Los Angeles, Oslo, Ottawa, Tbilisi, Lagos, Male, Mumbai, Helsinki, Budapest, Beijing and Cairo).
Number of Conferences by Category
This image shows the number of WASET conferences by category. You can see a larger version of it by clicking on the graph. The graph is sorted by the by the number of conferences in each category, with the top five categories being highlighted in green.
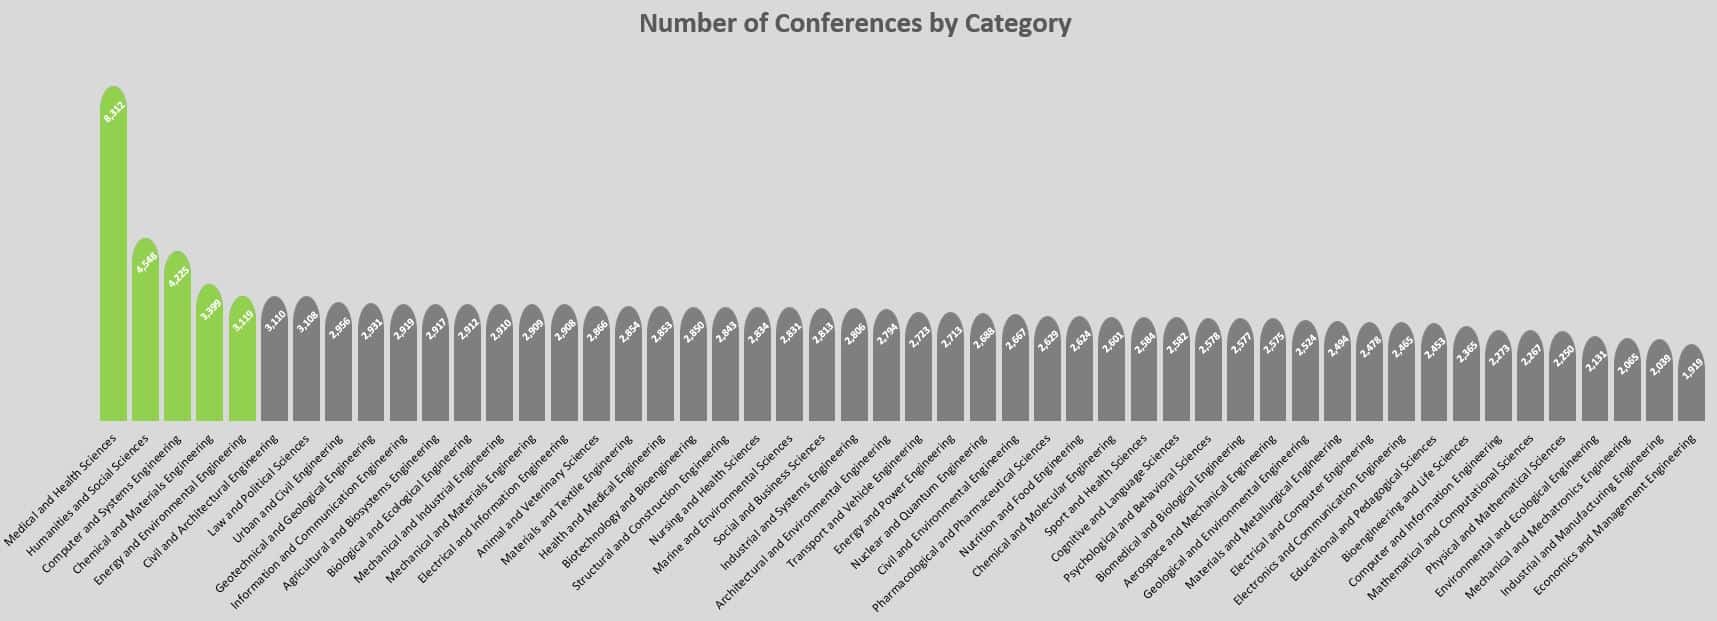
The largest number of conferences, by some mark, is in the Medical and Health Sciences category. There are 8,312 conferences in this category, with Humanities and Social Sciences (the second largest category) having 4,548. The least populated category (Economics and Management Engineering) still has almost 2,000 conferences.
Income Prediction
We thought it might be interesting to make some guesses at how much revenue these conferences generate.
It is probably unrealistic to believe that all the 142,791 of the conferences actually take place, but let’s be really pessimistic and assume that just 1% of them do, that is 1,428. If each of those conferences get five papers submitted and each participant pays USD 450 (which might be a slightly underestimate as the standard rate is EURO 450, which is closer to USD 500), that gives a total revenue of (1,428 * 5 * 450) = USD 3.213M.
Of course, there will be expenses, but some reports say that there is only one booked for all the conferences. Conservatively, this should still see a profit of USD 2.5M.
… and bear in mind, we have been very conservative. The following table shows some other scenarios.
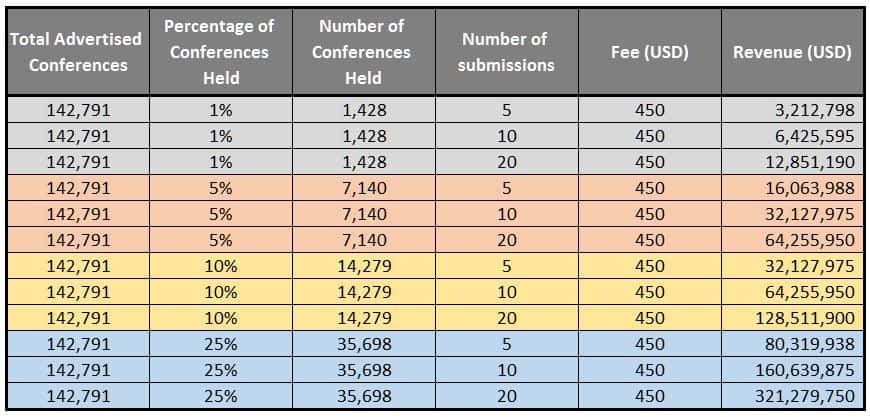
The scenario we mentioned above is shown in the top row. The other rows change the number of conferences held (1%, 5%, 10% and 25%). We also change the number of submissions (5, 10 and 20).
If the first row is an underestimate, the last row is probably an overestimate but if 25% of the conferences took place and they each received 20 submissions that would give a total revenue for 2020 of USD 321M.
This analysis correlates with the findings of Svea, Suggy, Till who, in their presentation to DEFCON, said that WASET’s revenue was about USD 4.5M. Like ours, it was estimated and based on 20-25 submissions to each conference but there were fewer conferences when they did their prediction (53,467). Their video is a very interesting watch and the figures we just mentioned can be seen at about 19 minutes, 50 seconds.
Media Coverage
WASET, and its conferences, has been covered in the media. Below is just some of the coverage that WASET has received.
- Inside the Fake Science Factory (Sep 2018): This was the video we mentioned above and it is certainly worth watching. The presentation at DEFCON received a lot of press coverage and a serach on the internet will track these down.
- ‘Predatory conference’ organiser ‘flees’ from angry academics (Oct 2018): This article relates the experiences of Jane Essex, from the University of Strathclyde. She travelled to Vancouver to present a a paper at a WASET conference. Finding out that it was a predatory conference she used her to talk to others about the predatory nature of WASET conferences.
- Ignorance of predatory conferences means warning signs are missed (Oct 2017). This article asks why smart scholars fall for predatory conferences. This article does not mention WASET, but it does mention a conference that WASET hosted in Copenhagen.
- Predatory conferences ‘now outnumber official scholarly events’ (Oct 2017): The main point of this article was to make the point that predatory conferences now outnumber official scholarly events. The article also relates the experiences of one person who attended a WASET in Copenhagen.
Final Thoughts
It does seem incomprehensible that any organization could plan/run over 140,000 conferences in a single year. It appears that WASET has been doing this for many years and, if anything, the number of conferences they advertise is increasing, rather than decreasing.
We have not been to any WASET conferences, so cannot relate any personal experiences. Indeed, we would be interested if anybody is willing to share any experiences they have had or, if there is a WASET conference near you, just visit the hotel to see the scale of the event(s) and whether the conferences being run match the advertised schedule.
In the meantime, we would urge caution about submitting to, or attending, a WASET conference. Indeed, if you are new to writing an academic paper for conferences, you might want to take a look at “Writing for Conferences: A Handbook for Graduate Students and Faculty” by Leo A. Mallette. The Amazon link is here.
Article history
Where an article has been updated since first being written, we provide a history of the changes. Why? Why not :-).
- The original article was published on 5 January 2020.
- The article was updated on 16 June 2023. The main content was not changed but we reformatted it a little (as we now have more experience with the tools we use) and also to try and improve the flow. We also updated the header image, which (for some reason) was displaying much smaller that it should have been.